Freediving With Data: How I Turned Garmin Chaos Into Clear, Actionable Insights
Stop guessing what happened during your dives. This tool turns messy Garmin logs into clear dive profiles—detecting phases, heart rate trends, and MDR activation. Get actionable insights to improve relaxation, safety, and performance in every session.

For a long time, analyzing my freediving sessions felt like trying to decode encrypted messages. I went to Garmin Connect dive sessions, stare at messy charts, and still have no idea what was actually happening during a dive. When did the dive really start? How was my heart responding? What was going on in the 30 seconds before I submerged — or in the first moments after resurfacing?It became even more challenging because the freediving mode on Garmin smartwatches doesn’t work properly in shallow pools, neither for dynamics nor for statics. Comparison of several dives on the same distance? Impossible.
The truth:
Garmin logs are maybe great for running and cycling… and quite useless for freediving.
No structure.
No dive time recognition.
No easy way to compare multiple dives.
Just noise.
Just try to solve the riddle 🤔⁉️
On the chart below, extracted from Garmin Connect portal you should be able to find eight dives, that I performed during my training session. Probably you already spotted them, right? Was this easy? No.
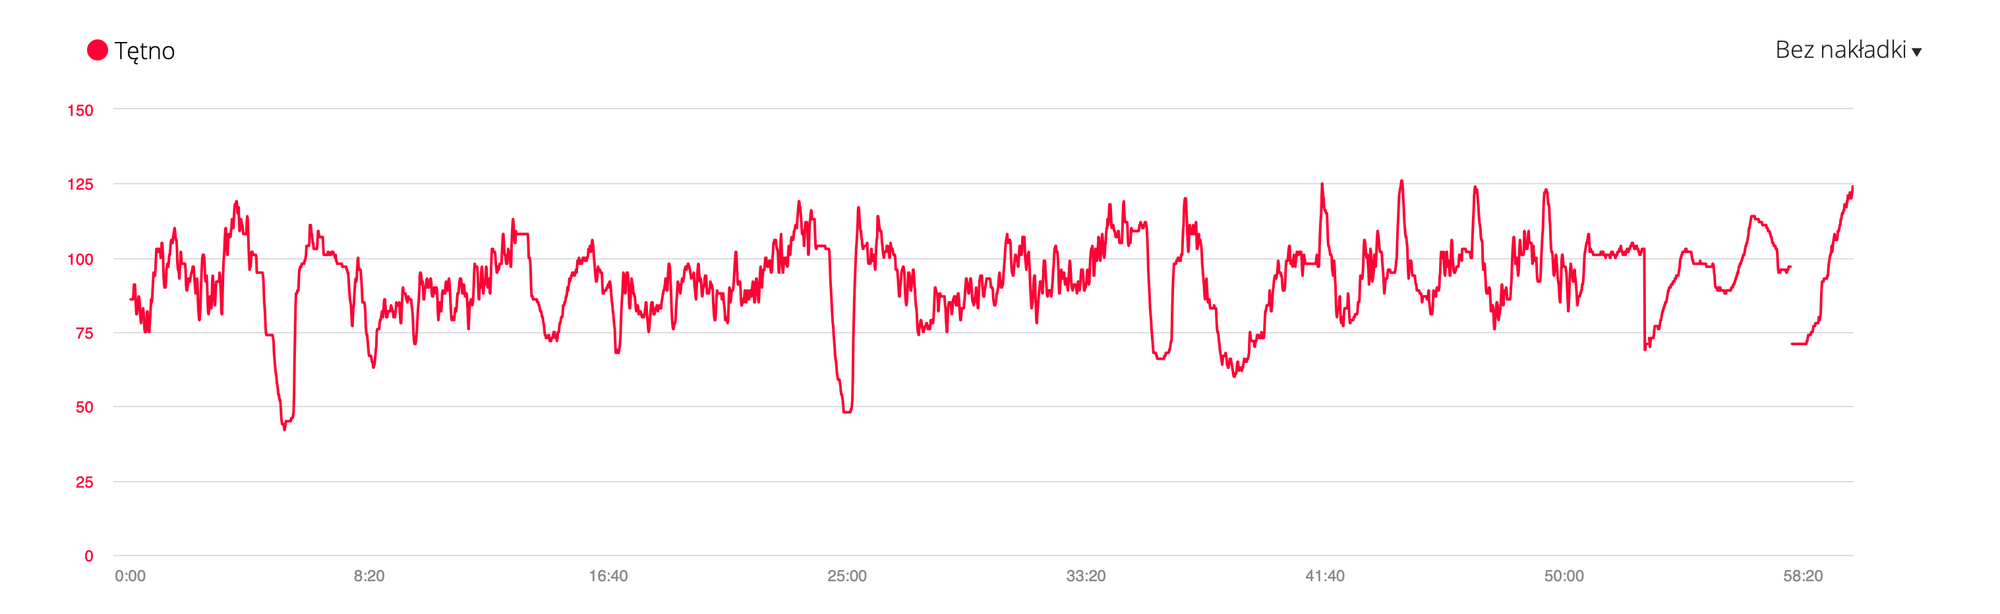
Now, try to provide dive start and dive end times and duration of the breath hold. Impossible, right?
Eventually I decided: If I want insights, I have to build the structure myself and tool that will enable easy access to the ❤️ Heart Rate data that I have from my dives.
A Sneak Peek at What’s Coming
I’m currently developing a tool that can do all of this for you — automatically extracting, structuring, and visualizing your freediving data so you can dive deeper into your own training insights. It turns a chaotic 40–90 minute session into a set of clear, comparable dive profiles. it will make post dive assessment extremely easy and accurate.
📣 If this sounds useful, feel free to reach out 💬. It may help you uncover patterns in your sessions you’ve never noticed before.
Look again at the same session, but this time on the generated charts:
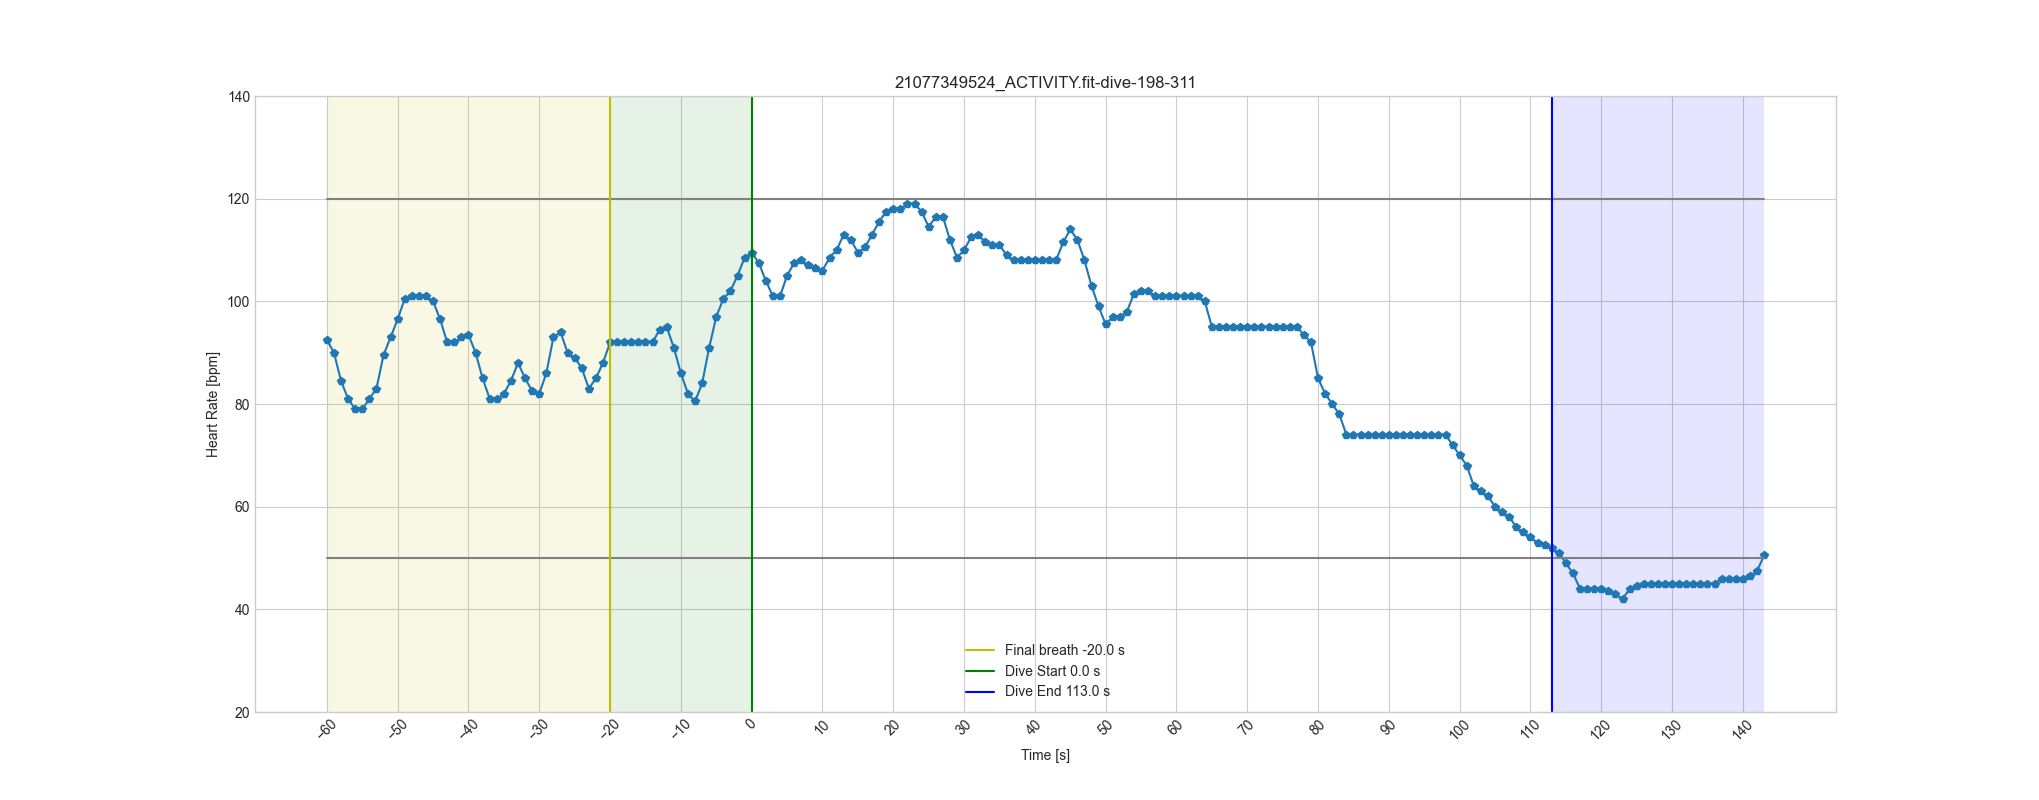
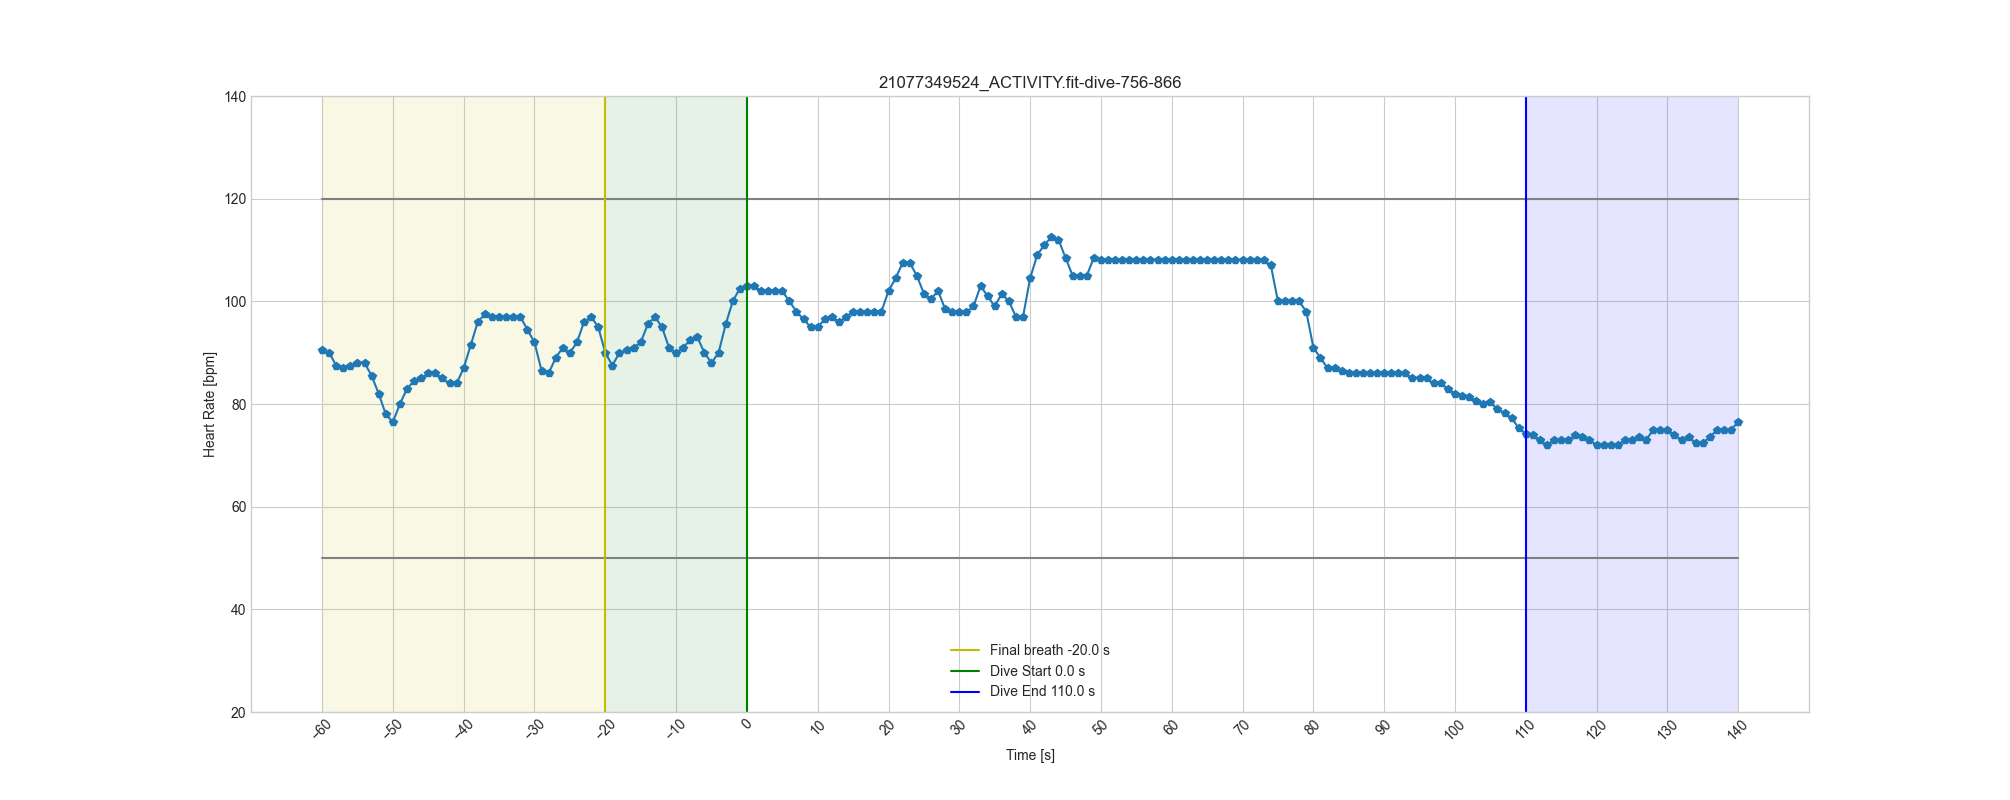
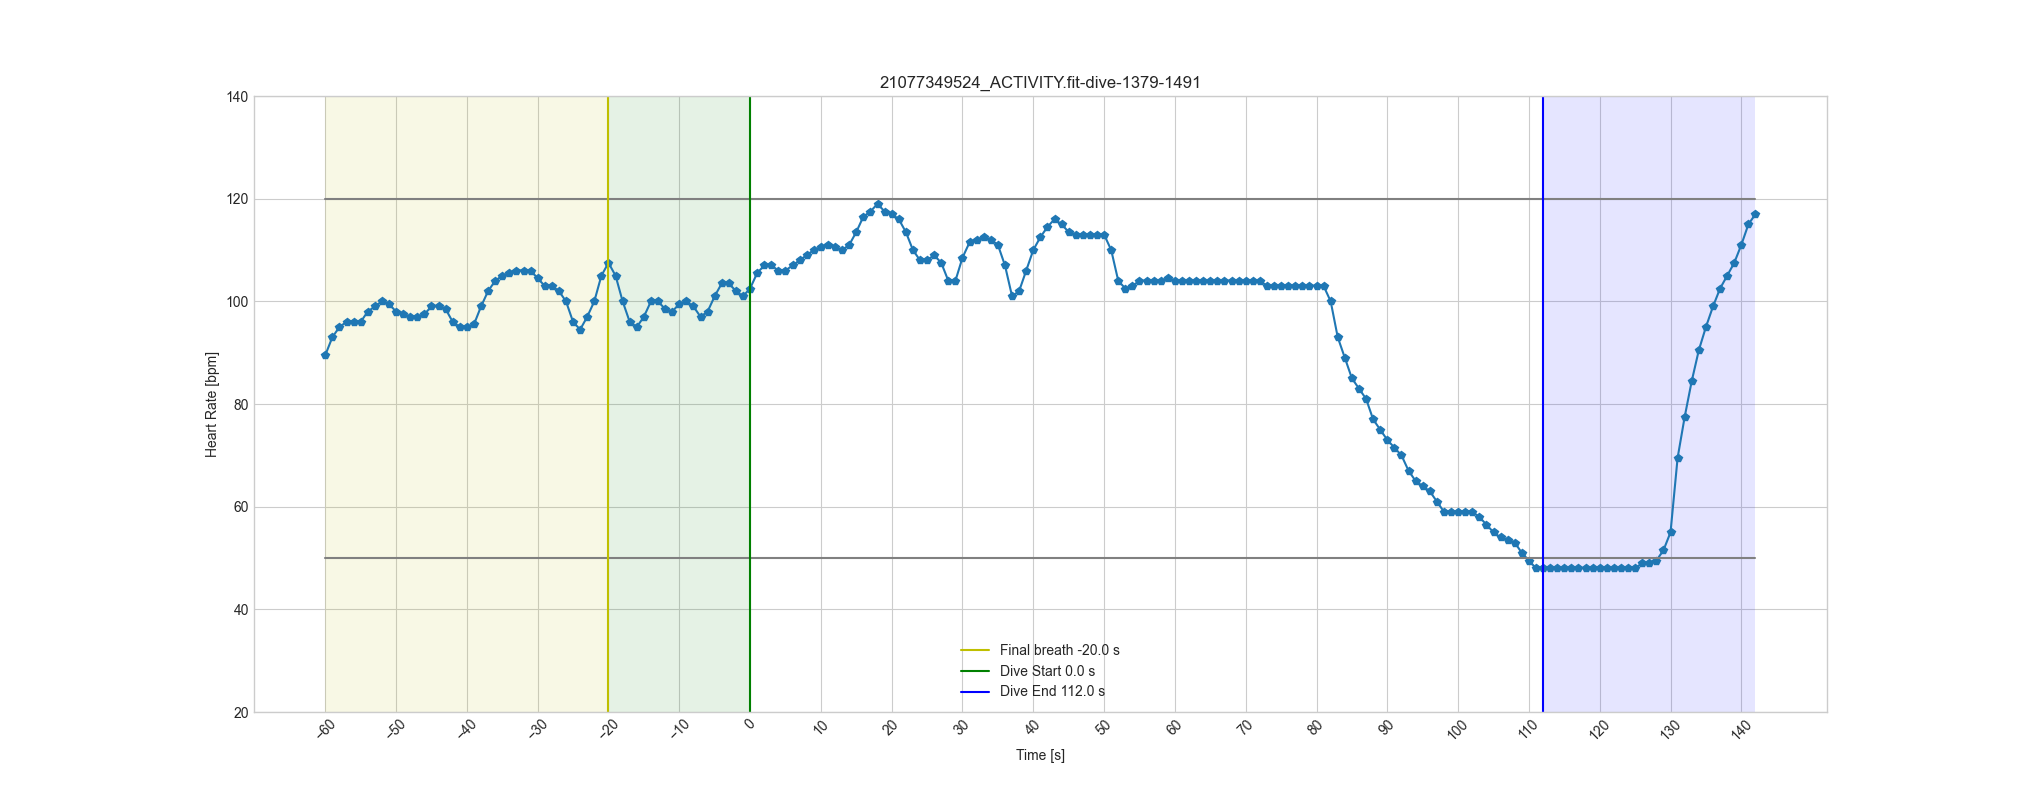
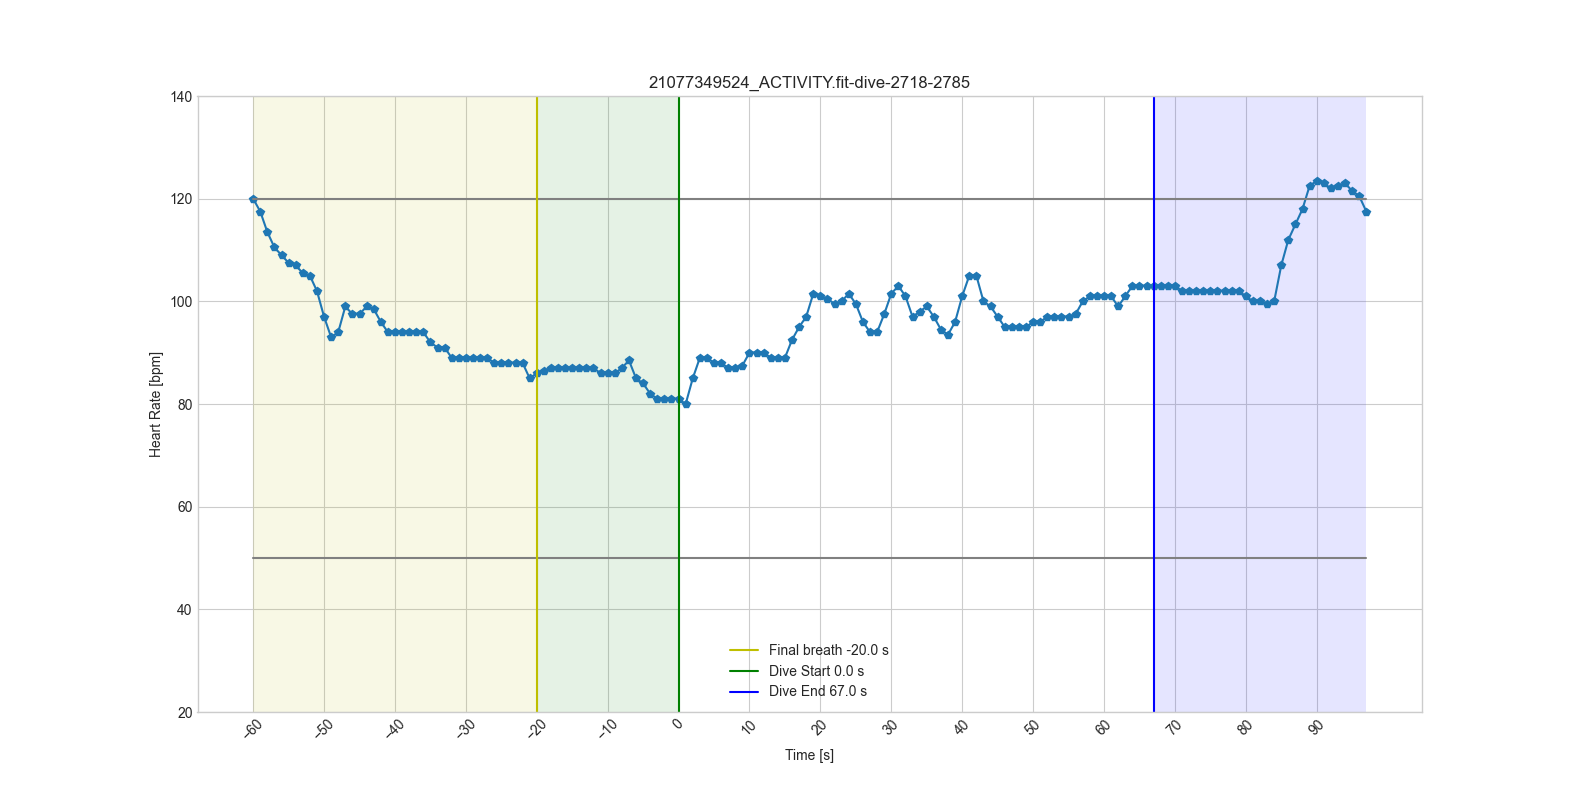
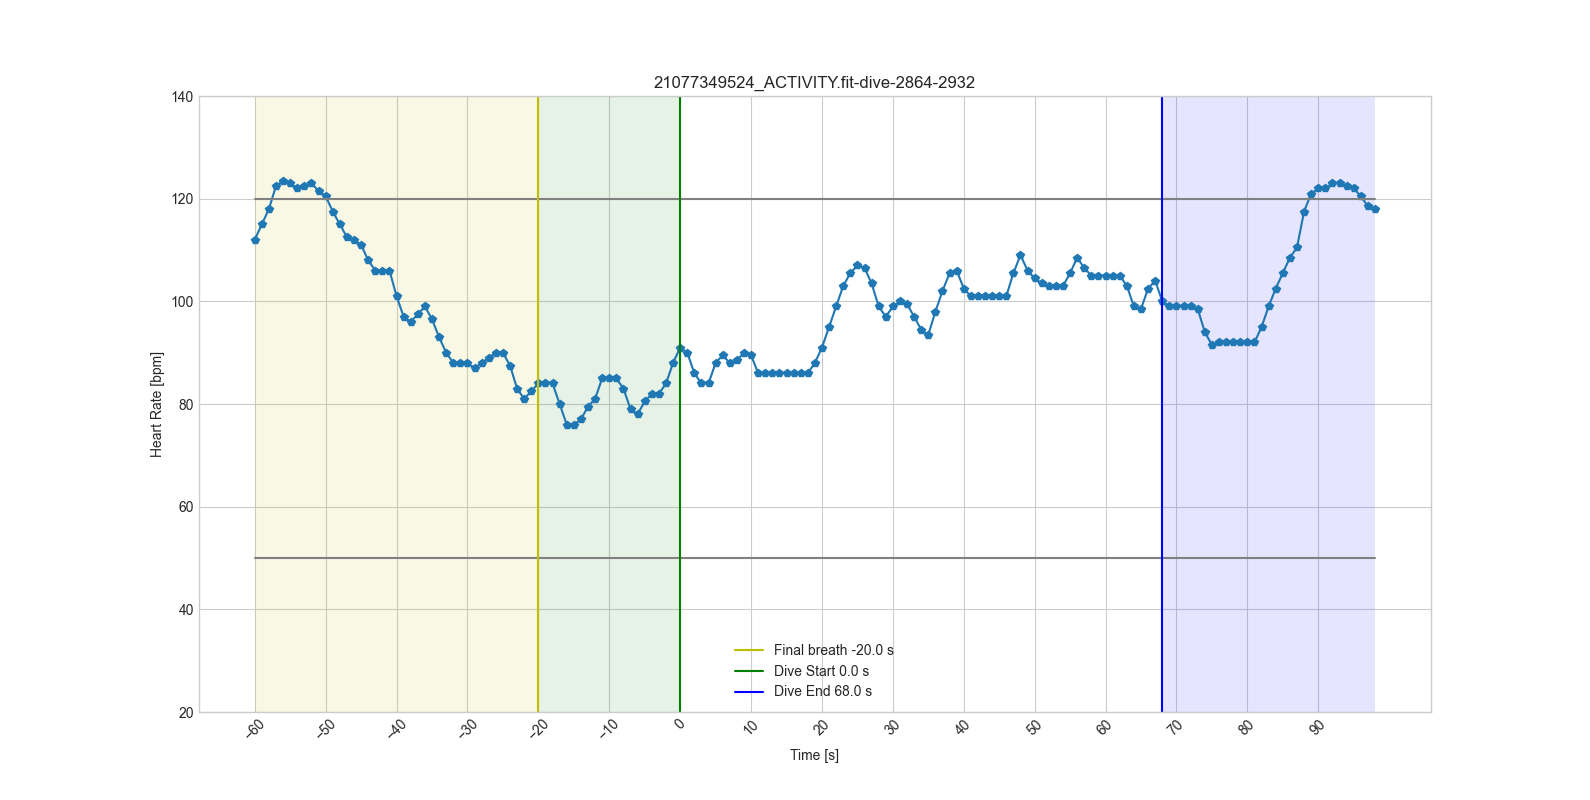
Same data, different view. Now they can be used to assess the dive, and to better understand it.
Structuring the Dive
After many experiments, I developed a simple but powerful framework that turned chaotic data into clear, comparable diagrams. Every dive, regardless of session or distance, now follows the same five stages:
- Preparation
- Pre-dive breathing
- Final breath window
- Dive
- Recovery
Once I applied this structure, everything clicked.
Suddenly the story of each dive became visible: